Power BI – Changing the Face of Reports?
Published: 16/09/15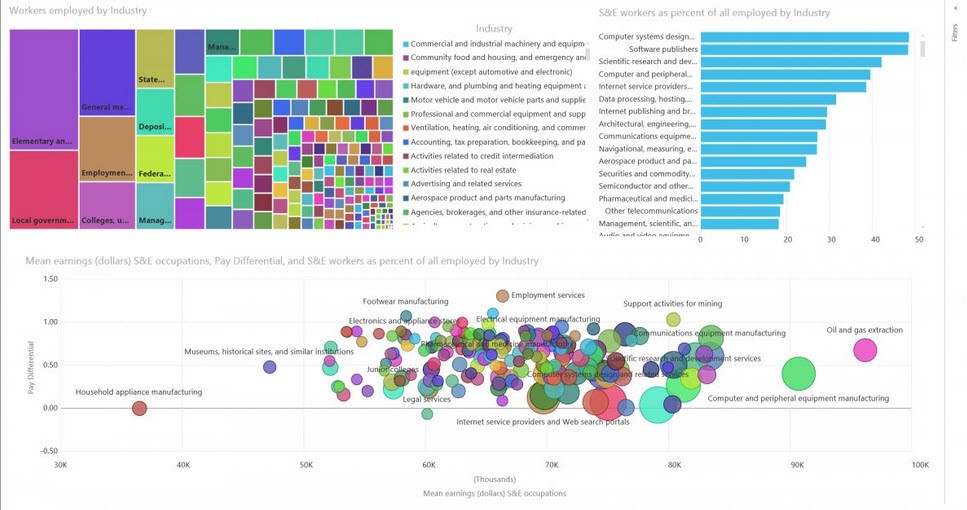
Decisions, decision, decisions. We all make them but not always with the best data to hand. ERP software solutions such as Microsoft Dynamics NAV have for many years delivered powerful data reports which support a wide variety of business decision making. Such reporting has been enhanced by the emergence of complimentary reporting tools such as SSRS, (SQL Server Reporting Services), and Jet Reports to name but a few. However, with the emergence of Microsoft’s Power BI solution, has reporting just become even easier? If so, will this make decision making more effective?
Key Features and Benefits
Power BI is a cloud based analytics business intelligence solution that allows you to examine and understand data insights, (often in tandem with Office 365 applications). It uses a combination of technologies and tools to make presenting and organising data easy and manageable.
In a snapshot:
- Power BI enables you to create, share and visualise reports and dashboards using an intuitive, user friendly interface.
- ‘Question & Answer’ functionality enables users to easily query data and generate immediate interactive visualisations.
- Power BI Designer is free to download and comes with 1GB of free storage.
Results
Power BI will certainly have significant appeal for utilities where IT or Finance reporting is constrained. The solution’s simplicity, flexibility and cost effectiveness means that it will definitely win fans where access to data insights has been limited in the past.
Complex certified training is not required to use and understand Power BI, primarily due to its intuitive user interface. Something which potentially sets it apart from alternative reporting tools. You do not have to understand the product, just the situation!
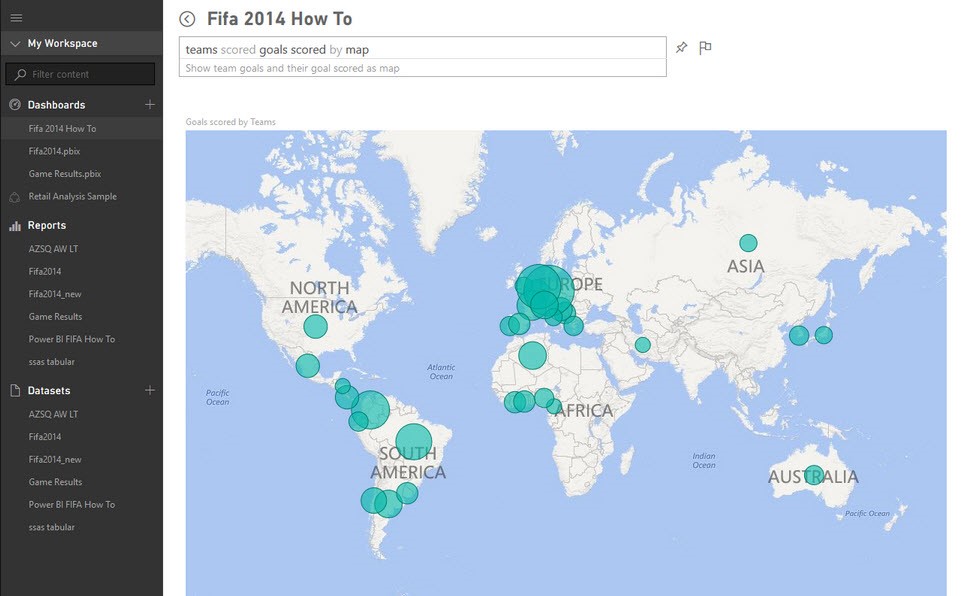
Power BI Q&A
One of the main differences that make Power BI stand out is the Q&A section. Questions regarding data sets can simply be popped into a search feature within Power BI and it immediately brings up easy-to-read graphical displays. This is more than a ‘nice to have’ feature. It revolutionises the way users interact with data, delivering insights and understanding.
Why Power BI Stands Out
- Setup time and costs are low.
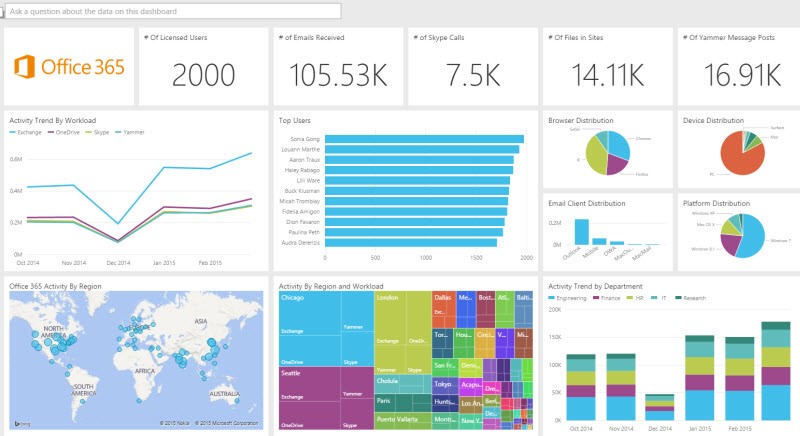
- Dashboards can be quickly and easily configured.
- Alternative data sources can be rapidly selected, e.g. SQL databases or Excel spreadsheets.
- Personalised dashboard visuals can be securely shared within the business or with external partners / stakeholders.
So… Is Power BI Changing the Face of Reports?
Well, Microsoft products certainly have mass market appeal and a big part of this is the level of integration, flexibility and the intuitive nature of the products. Power BI scores strongly in each of these areas and perhaps in truth, reporting is an area which needed some improvement. The core strength of this product is its ability to enable people throughout an organisation to query data to gain valuable insights, creating an opportunity for decisions to be made in a timely and effective manner.
Perhaps stating that Power BI is changing the face of reports may be going a little too far at this stage. For that, the product needs to be broadly adopted. However what is clear is that all the ingredients are present for this solution to make a big impact. It will be interesting to see how the utility industry in particular uses this product to deliver positive change in future.
B a c k t o K n o w l e d g e